This item is no longer available.
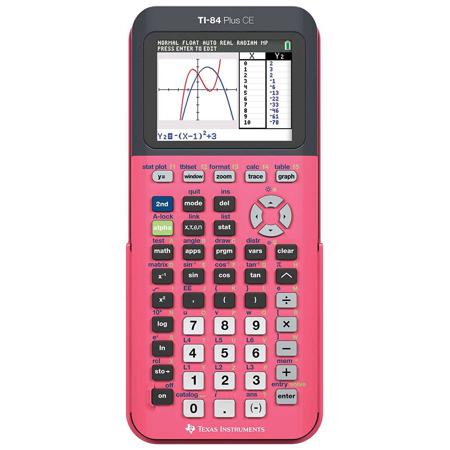
Familiar TI-84 Plus functionality in a sleek new design that features a crisp color screen.
Surprisingly slimmer. Lots lighter. Totally TI-84 Plus.
Captivating Color. Optimal Display.
Visualize concepts clearly and make faster, stronger connections between equations, data, and graphs in full color.
• Enhanced screen readability with high-resolution, backlit display
• Distinguish between multiple graphs and plots with color-coded equations, plots and objects
• Make graphs easier to read by adding grid lines
Approved for Exams
The TI-84 Plus CE is approved for use on the following exams:
• PSAT, SAT, and ACT college entrance exams
• AP Exams that allow or require a graphing calculator
• Approved for use on the IB exam
Familiar TI-84 Plus Family Functionality
Use More, Replace Less
The TI Rechargeable Battery conveniently recharges using a USB cable, wall charger or TI-84 Plus C Charging Station.
Familiar TI-84 Plus Family Functionality
The same menu structure and navigation as the TI-84 Plus family make it easy to pick up and learn. Built-in MathPrint functionality allows you to input and view math symbols, formulas and stacked fractions exactly as they appear in textbooks.
Make Real-World Connections
Deepen student understanding of math concepts with images. Import photos from a computer to the calculator and graph on top of the images to create an engaging learning experience.
Built-in Functionality
• Add images to graph background
• 15 colors for function graphing
• Change style and color of axes and grids on graphs
• Catalog Syntax Help
• Alphabetical CATALOG of all TI calculator operations in one menu
• Advanced functions accessed through pull-down display menus
• Real and complex numbers calculated to 14-digit accuracy and displayed with 10 digits plus a 2-digit exponent
• Graphs 10 rectangular functions, 6 parametric expressions, 6 polar expressions, and 3 recursively-defined sequences
• Up to 10 graphing functions defined, saved, graphed and analyzed at one time
• Sequence graphing mode shows time series plot, cobweb/stair-step plot and phase plots
• User-defined list names. Lists store up to 999 elements
• 17 interactive zoom features
• Numeric evaluations given in table format for all graphing modes
• Interactive analysis of function values, roots, maximums, minimums, integrals and derivatives
• 8 different graph styles for differentiating the look of each graph drawn
• Horizontal and vertical split- screen options
• View graph and table side-by-side
• Stores up to 10 - 50x50 matrices
• Matrix operations including inverse, determinant, transpose, augment, reduced row echelon form and elementary row operations. Convert matrices to lists and vice-versa
• List-based one- and two-variable statistical analysis, including logistic, sinusoidal, median-median, linear, logarithmic, exponential, power, quadratic polynomial, cubic polynomial, and quartic polynomial regression models
• 3 statistical plot definitions for scatter plots, xy-line plots, histograms, regular and modified box-and-whisker plots, and normal probability plots
• Advanced statistics features including 10 hypothesis testing functions, 7 confidence interval functions and one-way analysis of variance
• 15 probability distribution functions including Normal, Student-t, Chi-square, Binomial, and Poisson
• Business functions including Time-Value-of-Money (TVM), cash flows, and amortization. Full screen interactive editor for solving TVM problems
• Interactive equation solver editor allows solving numerically for different variables in an equation
• 11 Regression calculations